AWS provides a complete monitoring engine called CloudWatch; it works with metrics – including custom, user-provided metrics – and is able to raise alarms when any such metric crosses a certain threshold. This is the tool that is used for all perfomance monitoring tasks within AWS.
This text will cover a monitoring scenario regarding deploying an arbitrary appplication to the cloud and being able to determine what causes the performance limits to be met, be it the application code itself or resource limits enforced by Amazon.
Scenario
Let’s assume that one has just started using Amazon Web Services and is deploying applications on free tier or other general purpose (T2) instances. One learns that the general purpose instances work with “credits” that allow dealing with short spikes through performance bursting – but once the credits are exhausted the performance is reverted to some baseline. All the particular details do not make a lot of sense but one needs to know if the application can meet the desired service limits with this setup.
Prerequisites
If you are in charge of making sure the desired service limits are met or exceeded, then you need to be in control of the application environment. Any of the following bullets are red flags that should be immediate deal breakers:
Not being given full access to the AWS Console (EC2) to be able to experiment with instance and storage volume types.
Not being given access to the monitoring engine (CloudWatch).
If you are only given a server instance in the “cloud” and told to deploy the application and then meet some service limits, you should simply run away from that project. Yes, do run – you’re being set for failure through no fault of your own.
Internal Monitoring?
AWS does not offer internal monitoring (getting hypervisor metrics from within the instance, without going to an external service). This is the standard industry practice that all monitoring should be external. From within the instance any resource cap being met will not be immediately visible as such, but rather as general slowness or even timeouts.
Note: one can retrieve static data from within the instance (the so-called meta data), e.g.:
[root@ec2instance ~]# curl http://169.254.169.254/latest/meta-data/
ami-id
ami-launch-index
ami-manifest-path
block-device-mapping/
hostname
.
.
.
Monitoring with CloudWatch
For every instance or volume there is a tab in the console that displays a couple of graphs with metrics determined by the hypervisor (e.g. CPU utilization, network traffic, I/O statistics). By default these do not contain metrics that rely on the operating system (e.g. memory or disk usage) – one can define custom metrics for those and associate them with data from internal monitoring services. Amazon also provides such tools (e.g. Amazon CloudWatch Monitoring Scripts for Linux).
In the scenario above one must pay attention to the following metrics:
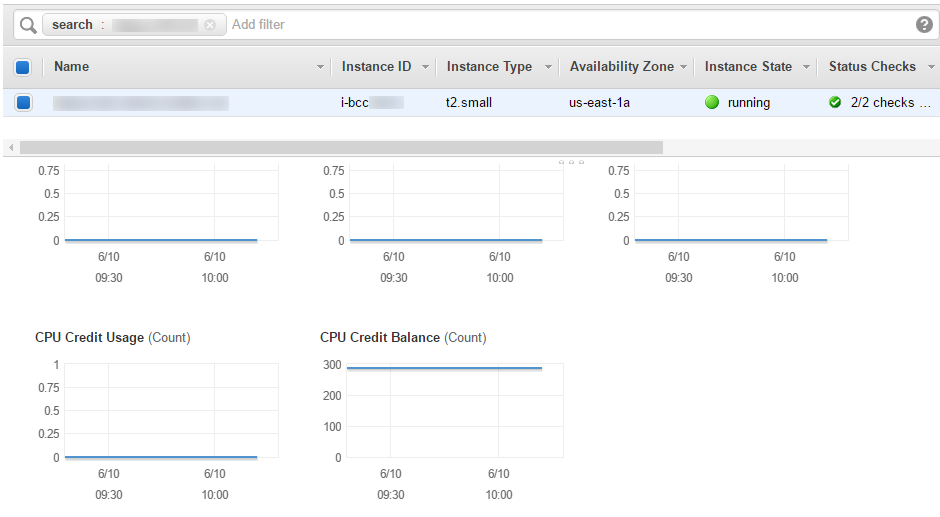
On the instance listing, the CPU Credit Usage and CPU Credit Balance. The credit usage is the prime indicator for computing spikes, while the balance, if ever reached 0, indicates that the instance computing performance was throttled by the hypervisor.

A constant CPU Credit zero balance indicates either a poor instance type choice for a compute-intensive application or some bug in the application itself. On a side note, this behavior can be easily replicated on any instance type by deploying a cryptocurrency miner or through a fork bomb.
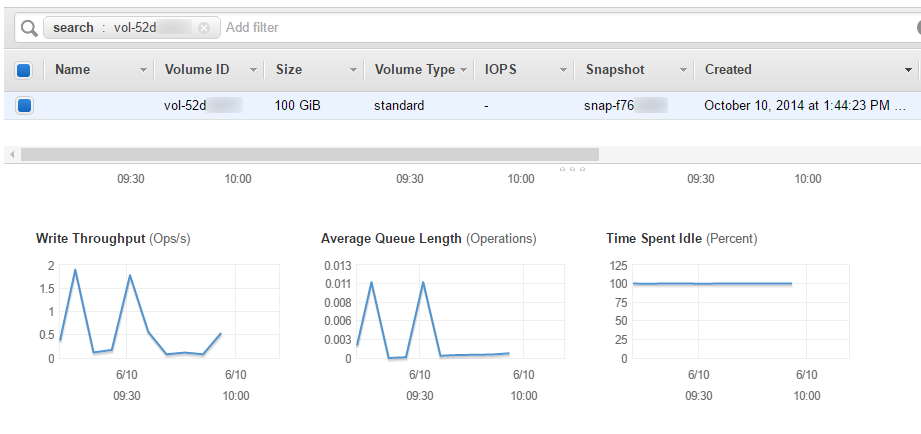
On the volume listing, the Average Queue Length. If the value is at least 1 over extended periods of time then read or write operations on the volume routinely exceed the IOPS limits (the default or the provisioned ones). For the actual IO type (read/write), one must check the Read Throughput and Write Throughput metrics.
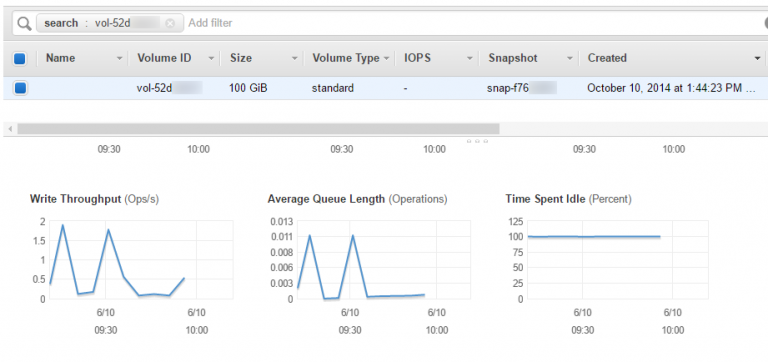
With certain usage scenarios (e.g. web servers), read rate can be reduced by using an instance type with more memory as this will automatically be used for file content caching. Excessive writes can sometimes be attributed to logging large amounts of information, so changing logging level to “error” (from “info” or “debug”) may actually help reduce the amount of data being written to the storage volume. If none of these apply, the solution is to either deploy a larger volume (the IOPS quota depends on the volume size for gp2 volume types) or define a “provisioned IOPS” (io1) volume.
Note 1: the CPU credit system applies to “T” instance types (general purpose) only. All other instance types provide their nominal performance at all times.
Note 2: IOPS limiting/provisioning apply to EBS (SSD) volumes only. Some instance types come with additional local (ephemeral) storage that provide performance closer to the hardware limits. Also, the newer hard drive storage types (st1, sc1) are throughput-limited rather than operation-limited.
Advanced Monitoring
One can get the CloudWatch-graphed data through the AWS CLI tools. This is useful for any advanced data analysis (e.g. from a certain period only). I will not cover the installation of these tools on the local machine; one needs a key pair generated in order to work with these.
On the monitoring side, an example set of steps to be taken can be:
1. Determine the instance data:
Note: this can be easily retrieved from the AWS console.
If there is a “Name” tag properly set for the instance:
$ aws ec2 describe-instances --filter Name=tag:Name,Values=myinstance.local
If the instance id is known:
$ aws ec2 describe-instances --instance-ids i-abcd1234
Out of the large json data block that is returned, the following 2 pieces of information should become known before going to the next step:
The instance id;
The volume id (or ids, if there are more).
2. Check the CPU credit balance:
$ aws cloudwatch get-metric-statistics --metric-name CPUCreditBalance --start-time 2016-06-05T23:18:00 --end-time 2016-06-06T23:18:00 --period 3600 --namespace AWS/EC2 --statistics Maximum --dimensions Name=InstanceId,Value=i-abcd1234
{
    "Datapoints": [
        {
            "Timestamp": "2016-06-06T21:18:00Z",
            "Maximum": 287.74000000000001,
            "Unit": "Count"
        },
        {
            "Timestamp": "2016-06-06T09:18:00Z",
            "Maximum": 287.81,
            "Unit": "Count"
        },
        .
        .
        .
While maximum was requested for the statistic in the example above, I suspect minimum may provide a better data insight. One must experiment with the various parameters in order to get the best combination.
Please note that data points are not in any way sorted. One must import the json document into some program to do the analysis.
3. Determine the metrics that are supported for the volume:
$ aws cloudwatch list-metrics --namespace AWS/EBS --dimensions Name=VolumeId,Value=vol-abcd1234
  {
    "Metrics": [
        {
            "Namespace": "AWS/EBS",
            "Dimensions": [
                {
                    "Name": "VolumeId",
                    "Value": "vol-abcd1234"
                }
            ],
            "MetricName": "VolumeQueueLength"
        },
        {
            "Namespace": "AWS/EBS",
            "Dimensions": [
                {
                    "Name": "VolumeId",
                    "Value": "vol-abcd1234"
                }
            ],
            "MetricName": "VolumeReadOps"
        },
        .
        .
        .
Please make note of the metric names – the wording is different compared to the graph title in the AWS Console.
4. Check the Average Queue Length for the volume:
$ aws cloudwatch get-metric-statistics --metric-name VolumeQueueLength --start-time 2016-06-05T23:18:00 --end-time 2016-06-06T23:18:00 --period 3600 --namespace AWS/EBS --statistics Sum --dimensions Name=VolumeId,Value=vol-abcd1234
{
    "Datapoints": [
        {
            "Timestamp": "2016-06-06T21:18:00Z",
            "Sum": 0.064336177777777712,
            "Unit": "Count"
        },
        {
            "Timestamp": "2016-06-06T09:18:00Z",
            "Sum": 0.0065512616666666586,
            "Unit": "Count"
        },
        .
        .
        .
A value of 0 is not possible – all operations go through the queue on their way to/from the storage. What we’re interested on is the actual time spent on the queue, which should be negligible for maintaining an optimal performance.
Again, please note that data points are not in any way sorted. One must import the json document into some program to do the analysis.
Conclusion
When working with Cloud environments, please be aware of their limitations: AWS instances do not behave like physical servers; they have various resource limits enforced by the hypervisor. One should always monitor the instance behavior through CloudWatch.
Note: This text was written by an AWS Certified Solutions Architect (Associate). Please do always work with an expert when setting up production environments.