Amazon CloudWatch is the monitoring tool for all the Amazon Cloud services. It offers both White Box and Black Box monitoring for services managed by Amazon and can be extended to work with user-generated monitoring data.
This text covers the integration of a simple MySQL monitoring script with Amazon CloudWatch.
MySQL Monitoring
Let’s assume that we want to monitor the number of active connections to the MySQL server and have an indication on when this figure becomes close to the maximal value defined in the configuration file (max_connections). In order to be portable, we may want to also report this value to the monitoring engine, even if it’s unlikely that a change may occur without explicit human intervention.
MySQL provides 3 numeric figures we may be interested in:
-
max_connections variable that can be retrieved with a “SHOW VARIABLES” query – the maximum number of allowed connections either as defined in the config file, or its default value;
-
threads_connected status value, retrievable with “SHOW STATUS”, the current number of connections;
-
max_used_connections status value, also retrievable with “SHOW STATUS”, the always increasing historical value tracking the maximal number of connections ever used since the last server restart.
All 3 seem interesting and you may actually want to have them all in the same single graph.
A simple shell script to query for these values may be:
#!/bin/sh

MYSQL_USER=xxxxx
MYSQL_PASS=xxxxx

case $1 in
	max_connections)
		mysql --user=$MYSQL_USER --password=$MYSQL_PASS -e "show variables like 'max_connections'" 2>/dev/null | grep -i "max_connections" | awk '{print $2}'
		;;
	max_used_connections)
		mysql --user=$MYSQL_USER --password=$MYSQL_PASS -e "show status like 'max_used_connections'" 2>/dev/null | grep -i "max_used_connections" | awk '{print $2}'
		;;
	threads_connected)
		mysql --user=$MYSQL_USER --password=$MYSQL_PASS -e "show status like 'threads_connected'" 2>/dev/null | grep -i "threads_connected" | awk '{print $2}'
		;;
	*)
		echo "Please provide one of max_connections, max_used_connections, threads_connected"
		exit 1
		;;
esac
Once we have these values related to a precise moment in time, let’s have them sent to CloudWatch.
CloudWatch Recording
In order to be able to “feed” data to CloudWatch, one must fill in a couple of details:
-
The timestamp associated with the metric;
-
The metric name, a free text value that will be visible in CloudWatch;
-
The namespace, also free text, which should be different from the AWS Namespaces – Amazon internal tools only can write metrics to them.
If we want to also associate the data with the instance one also needs to provide the instance id, but that is easily retrievable from the meta data. A very simple export script can be:
#!/bin/sh

max_connections=$(/usr/local/bin/mysqlmon.sh max_connections)

max_used_connections=$(/usr/local/bin/mysqlmon.sh max_used_connections)

threads_connected=$(/usr/local/bin/mysqlmon.sh threads_connected)

cdate=$(date -u +%Y-%m-%dT%H:%M:00.000Z)

instanceid=$(curl http://169.254.169.254/latest/meta-data/instance-id 2>/dev/null)


aws cloudwatch put-metric-data --metric-name MySQLMaxConnections --namespace "CustomMySQLMetrics" --dimensions="InstanceId=$instanceid" --value $max_connections --timestamp $cdate

aws cloudwatch put-metric-data --metric-name MySQLMaxUsedConnections --namespace "CustomMySQLMetrics" --dimensions="InstanceId=$instanceid" --value $max_used_connections --timestamp $cdate

aws cloudwatch put-metric-data --metric-name MySQLThreadsConnected --namespace "CustomMySQLMetrics" --dimensions="InstanceId=$instanceid" --value $threads_connected --timestamp $cdate
Note: The AWS CLI tools installation and configuration is not covered in this text. You may want to follow the tutorial provided by Amazon in order to get the tools installed and also have an access key pair ready for the configuration. The access key must be associated to either the root user (a bad idea for many reasons) or an IAM user account with full CloudWatch access.
How often should one run this script? It depends. The timestamp accuracy, as one can quickly make note of, is 1 minute, but this does not limit anything on the CloudWatch side. If multiple readings are provided for the sampling interval, CloudWatch is able to provide statistical insights such as the minimum, the maximum, the average or the sum of the values provided.
For 1 minute exports, a truly simple cron definition is:
* * * * * /usr/local/bin/aws_mysql_pub.sh
CloudWatch Sample Graph
The final result of this operation may be similar to:
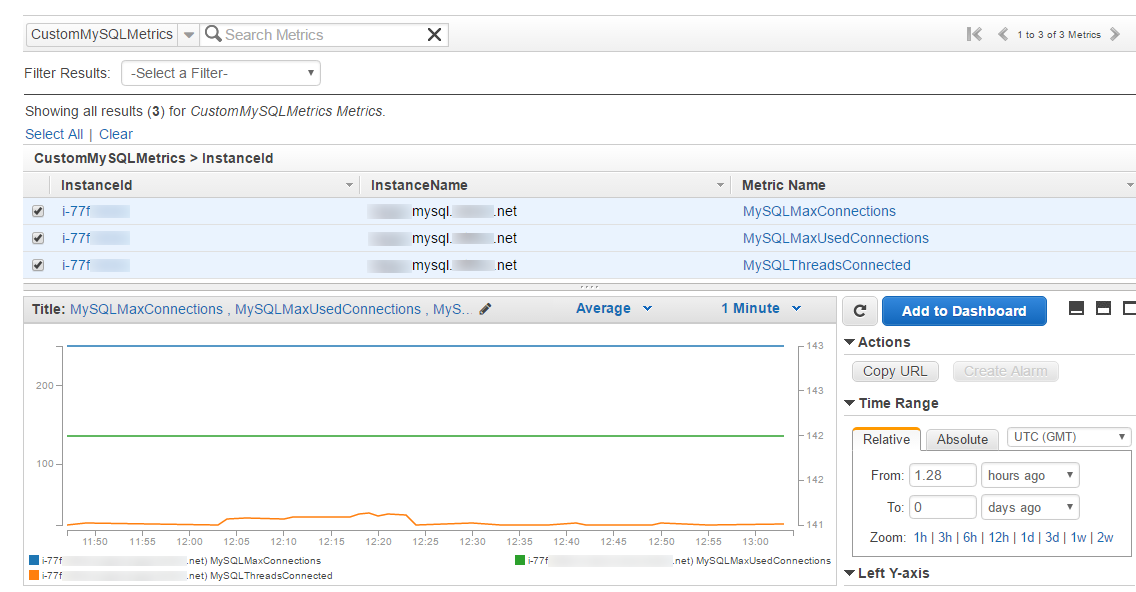
Note: the display can be made cleaner (the right Y axis can be scaled to match the left one). One can also add alarms triggered by the graphed values, but unfortunately, as of now, CloudWatch does not support the comparison between metrics as an alarm trigger.
While looking at the graph above one may wonder about the costs; the good news is that CloudWatch is one of the few services with free tier offering that does not expire after the first year. Otherwise, the complete pricing schema can be found here.
That’s it for today. Thank you for your read!
Note: This text was written by an AWS Certified Solutions Architect (Associate). Please do always work with an expert when setting up production environments.