
MySQL Monitoring with Amazon CloudWatch
Amazon CloudWatch is the monitoring service for the Amazon Cloud. It supports both white box and black box monitoring of AWS-managed services, and it can also ingest custom monitoring data that you generate yourself.
This guide shows how to integrate a simple MySQL monitoring script with CloudWatch.
Suppose you want to track the number of active connections to your MySQL server and get a signal when that number approaches the limit set by max_connections in the configuration file. For portability, it’s also worth reporting the limit itself to the monitoring system, even though it rarely changes without someone editing the configuration.
MySQL exposes three numeric values that are useful here:
max_connections: a server variable, read withSHOW VARIABLES. It is the maximum number of connections allowed, either as set in the config file or the default.threads_connected: a status value, read withSHOW STATUS. It is the number of connections open right now.max_used_connections: also a status value fromSHOW STATUS. It is a high-water mark of the most connections ever used since the last server restart, so it never decreases.
All three are valuable, and you may want them plotted together on a single graph.
Here is a simple shell script (mysqlmon.sh) that retrieves them:
#!/bin/sh

MYSQL_USER=xxxxx
MYSQL_PASS=xxxxx

case $1 in
	max_connections)
		mysql --user=$MYSQL_USER --password=$MYSQL_PASS -e "show variables like 'max_connections'" 2>/dev/null | grep -i "max_connections" | awk '{print $2}'
		;;
	max_used_connections)
		mysql --user=$MYSQL_USER --password=$MYSQL_PASS -e "show status like 'max_used_connections'" 2>/dev/null | grep -i "max_used_connections" | awk '{print $2}'
		;;
	threads_connected)
		mysql --user=$MYSQL_USER --password=$MYSQL_PASS -e "show status like 'threads_connected'" 2>/dev/null | grep -i "threads_connected" | awk '{print $2}'
		;;
	*)
		echo "Please provide one of max_connections, max_used_connections, threads_connected"
		exit 1
		;;
esac
With these point-in-time values available, the next step is to push them to CloudWatch.
To submit a custom metric, you need to supply a few details:
- Timestamp: the time the reading applies to.
- Metric name: free text that will appear in the CloudWatch console.
- Namespace: also free text, but it must not collide with the reserved AWS namespaces, which only Amazon’s own services may write to.
To tie the data to a specific instance, you also need to pass the instance ID, which is easy to obtain from the instance metadata. A minimal publishing script (aws_mysql_pub.sh) looks like this:
#!/bin/sh

max_connections=$(/usr/local/bin/mysqlmon.sh max_connections)

max_used_connections=$(/usr/local/bin/mysqlmon.sh max_used_connections)

threads_connected=$(/usr/local/bin/mysqlmon.sh threads_connected)

cdate=$(date -u +%Y-%m-%dT%H:%M:00.000Z)

instanceid=$(curl http://169.254.169.254/latest/meta-data/instance-id 2>/dev/null)

aws cloudwatch put-metric-data --metric-name MySQLMaxConnections --namespace "CustomMySQLMetrics" --dimensions="InstanceId=$instanceid" --value $max_connections --timestamp $cdate

aws cloudwatch put-metric-data --metric-name MySQLMaxUsedConnections --namespace "CustomMySQLMetrics" --dimensions="InstanceId=$instanceid" --value $max_used_connections --timestamp $cdate

aws cloudwatch put-metric-data --metric-name MySQLThreadsConnected --namespace "CustomMySQLMetrics" --dimensions="InstanceId=$instanceid" --value $threads_connected --timestamp $cdate
Note: Installing and configuring the AWS CLI is outside the scope of this guide. Amazon’s installation tutorial covers it, and you’ll need an access key pair ready for the configuration. The key should belong to either the root user (a poor choice for many reasons) or, preferably, an IAM user with full CloudWatch access.
That depends on your needs. Timestamps have a one-minute resolution, but that doesn’t restrict you: if you send several readings within the same sampling period, CloudWatch can compute statistics over them, such as minimum, maximum, average, and sum.
For a one-minute interval, a basic cron entry is:
* * * * * /usr/local/bin/aws_mysql_pub.sh
The end result should look something like this:
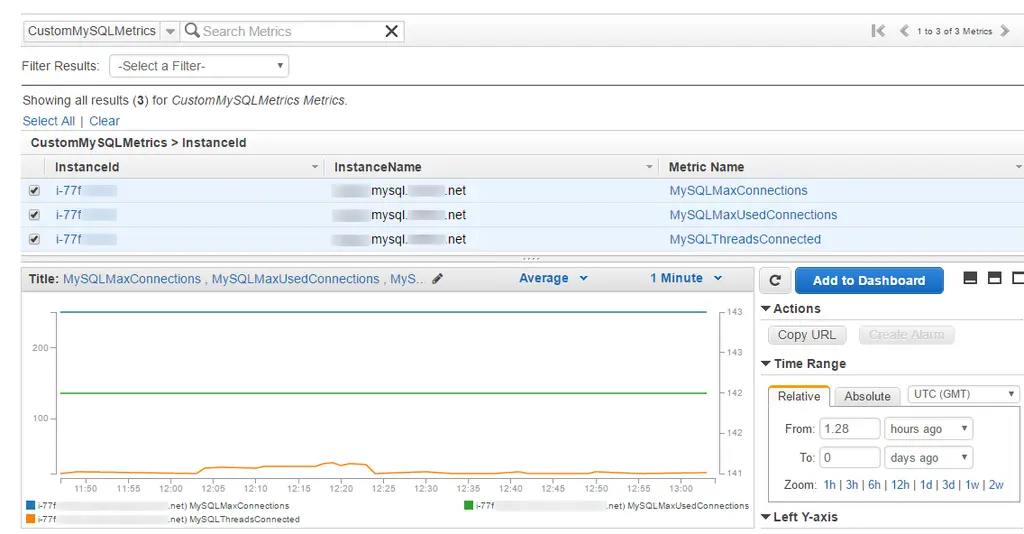
Note: The display can be tidied up, for example by scaling the right Y axis to match the left. You can also create alarms on the graphed values, but CloudWatch currently cannot trigger an alarm by comparing one metric against another.
Looking at the graph, you may wonder about cost. CloudWatch is one of the few AWS services whose free tier doesn’t expire after the first year. Full details are on the pricing page.
That’s all for now. Thanks for reading!
Note: This text was written by an AWS Certified Solutions Architect (Associate). Always consult an expert when setting up production environments.